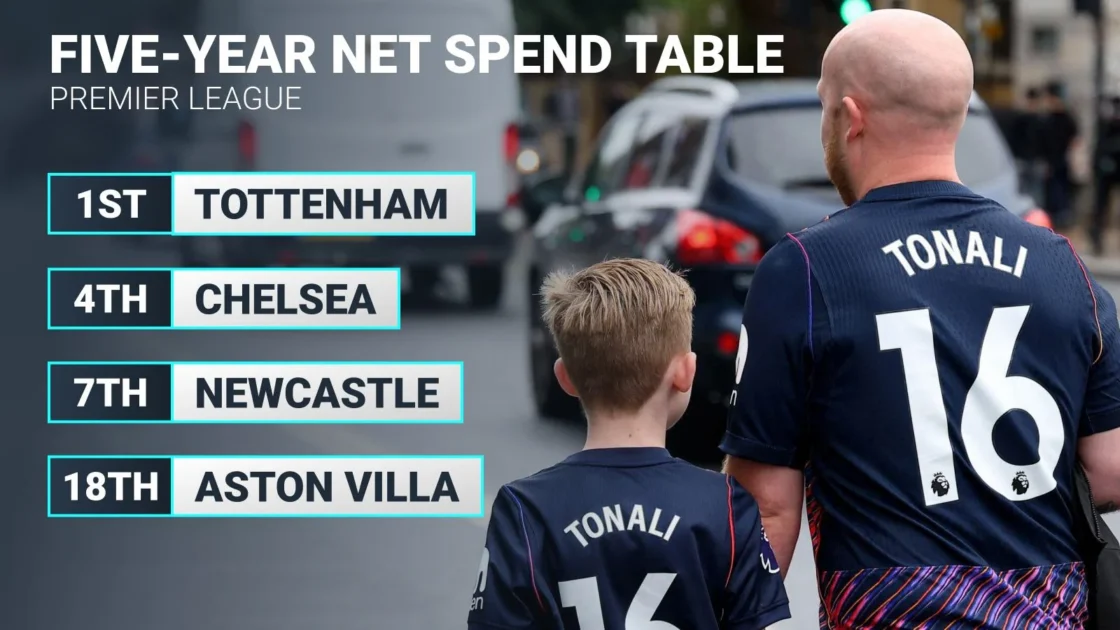
A comprehensive five-year net spend table tracking transfers from the summer of 2022 to the present day reveals that Manchester United trail only Tottenham Hotspur in total spending.
The Top Spenders Led by Tottenham and Manchester United
Topping the financial table as analyzed by Football365, Tottenham Hotspur record a five-year net spend of £-695.95m. Their yearly breakdown shows figures of £-173.34m for 26/27, £-156.46m (finishing 17th) for 25/26, £-110.39m (17th) for 24/25, £-125.5m (5th) for 23/24, and £-117m (8th) for 22/23.
Manchester United sit second with a five-year net spend of £-664.4m. Their seasonal figures comprise £-100.82m in 26/27, £-147.68m (3rd) in 25/26, £-102.56m (15th) in 24/25, £-128.48m (8th) in 23/24, and £-191.94m (3rd) in 22/23.
Arsenal occupy third place with a five-year net spend of £-621.7m, split across £-78.91m for 26/27, £-246.26m (Champions) for 25/26, £-20.81m (2nd) for 24/25, £-144.26m (2nd) for 23/24, and £-141.39m (2nd) for 22/23.
Chelsea follow closely in fourth with a five-year net spend of £-608.45m, featuring a profit of £35.25m in 26/27, alongside £0.1m (10th) in 25/26, £-19.24m (4th) in 24/25, £-144.65m (6th) in 23/24, and £-485.17m (12th) in 22/23.
Liverpool round out the top five with a five-year net spend of £-569.66m, made up of £-200.22m in 26/27, £-223.4m (5th) in 25/26, a profit of £29.14m (Champions) in 24/25, £-92.26m (3rd) in 23/24, and £-53.96m (5th) in 22/23.
Mid-Table and Lower Net Spend Standings
Manchester City register a five-year net spend of £-513.62m, divided into £-162.26m for 26/27, £-172.7m (2nd) for 25/26, £-87.75m (3rd) for 24/25, £-104.64m (Champions) for 23/24, and a profit of £5.94m (Champions) for 22/23.
Newcastle United total a five-year net spend of £-344.92m, with yearly figures of £-29.08m in 26/27, £-89.94m (12th) in 25/26, a profit of £18.26m (5th) in 24/25, £-95.55m (7th) in 23/24, and £-149.73m (4th) in 22/23. Nottingham Forest record a five-year net spend of £-300.1m, containing a £19.3m profit in 26/27, followed by £-97.28m (16th) in 25/26, £-15.58m (7th) in 24/25, £-42.28m (17th) in 23/24, and £-167.48m (16th) in 22/23.
Further down, Ipswich Town stand at £-282.31m, Bournemouth at £-205.16m, Fulham at £-198.75m, Sunderland at £-173.08m, and Brentford at £-164.84m across the monitored windows.
Coventry City register a net spend of £-140.89m, Hull City £-120m, Crystal Palace £-89.22m, Leeds United £-79.39m, and Aston Villa £-66.52m.
At the positive end of the financial spectrum, Everton record a five-year net profit of £3.34m, combining £21.19m in 26/27, £-101.87m (13th) in 25/26, £28.17m (13th) in 24/25, £36.23m (15th) in 23/24, and £21.7m (17th) in 22/23.
Brighton lead the table with the highest net profit, totaling £11.04m across the five-year span, driven by £10.86m in 26/27, £56.51m (8th) in 25/26, £-191.58m (8th) in 24/25, £69.1m (11th) in 23/24, and £70.82m (6th) in 22/23.